
@Wri2
WHICH PARAMETERS ARE MONITORED?
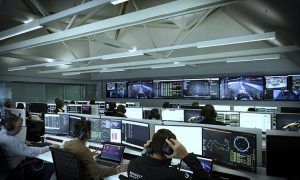
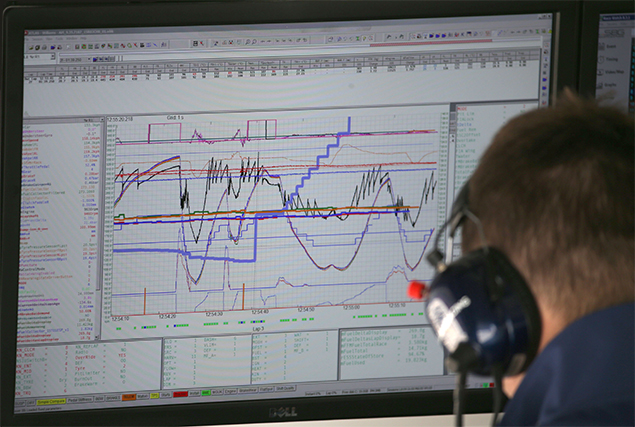
On the image above, a Williams engineer is looking at multiple boxes on his screen. On the left-hand side, a row compiles all the parameters. The values for any given time are shown by a vertical marker that appears in the form of a dotted line on the main screen. On the central graph, the curves show the evolution trend of the parameters over time. The box on the bottom left gather all the parameters that can be adjusted by the driver on its steering wheel, while the box on the right displays data related to fuel usage (load, consumption, etc.)
All parameters are preceded by a prefix that indicates the type of measurement unit: for instance, ‘vCar’ expresses a speed (‘v’), actually the change of position of the car over a certain period of time; ‘pBrake’ shows the pressure (‘p’) applied on the brakes, etc. Here is quick review of some key parameters F1 teams look at.
● vCar: speed of the car. Each wheel is fitted with a sensor measuring its own speed. This can vary depending on wheelspin, corner type, lock-ups, etc. Thus, vWheel FL (speed of the front left wheel) shows 154.3kph, while vWheel FR (front right) indicates 155.9kph. Each value is weighed, which gives a speed of 153.3km in that instance.
● aUndersteer: understeer, expressed in degrees (there is none here, 0.0°)
● xSteerRack: steering measurement (here the relative positioning on the steering rack: -0.68mm). It’s often expressed as a steering angle.
● rThrottlePedal: acceleration measurement, expressed in percentage of the pressure applied by the driver on the throttle pedal. 0% means he does not step on it at all, 100% he is flat-out (here 52.4%)
● NGear: Gear selected, from first to seventh (here: fourth)
● pBrakeF: brake pressure applied on the front, expressed in bar (here: 0.28bar)
● pBrakeR: brake pressure applied on the rear, measured at the rear master cylinder (here: 0.47bar)

©Wri2
● rBrakeBalDemand: brake balance (here: 50.66%)
● nEngine: revs of the V6 internal combustion engine (ICE), expressed in rpm (here: 9,638rpm)
● NLap: Lap number (here: Lap 3)
● pTyrePressureSensorFL/FR/RL/RR: Tyre pressure on the front left, front right, rear left, rear right, expressed in psi for pound-force per square inch (here: 20.5psi on the front left, 20.2psi on the front right, 19.3 on the rear left, 19.4 on the rear right)
● Puncture: pretty self-explanatory, expressed in binary format (‘0’ means ‘no’; ‘1’ means ‘yes’).
● WStateWingEnabled: DRS activation status, expressed in binary format (‘0’ means ‘no’; ‘1’ means ‘yes’).
● NRearWing StateDriverButton: DRS activation by the driver, expressed in binary format (‘0’ means ‘no’; ‘1’ means ‘yes’).
● MODE: Engine mode engaged by the driver on the steering wheel
● TRQ: Torque settings selected by the driver on the steering wheel.
● tCurrentDeltaLastLap: time gap (delta) with the previous gap, expressed in seconds (here: 3.8s)
● mFuel Remaining: fuel load remaining, expressed in kilograms (here: 1.82kg)
The above list is not exhaustive. The engineers, either sitting on the pit wall or at the back of the garage, can monitor in real time the evolution of other data measured in by the sensors: centrifugal forces, aerodynamic downforce, clutch position, pressure of the hydraulic system, oil pressure, temperature levels of the engine, transmission, coolant, exhaust system, etc.

©Wri2, McLaren, Mercedes